I audited an $8.4M/year supplement brand last month.
$112k monthly ad spend. TACoS climbing to 31%. Profit margins shrinking quarter over quarter.
Their previous agency kept saying, "We're scaling you—just be patient."
When I pulled the bulk files, I found $44k in wasted spend over 90 days. Broad match campaigns bleeding on search terms that never converted. Auto campaigns running on ASINs with 9% margin. Zero search term isolation. No margin-based TACoS targets.
That's not advertising. That's arson.
If you're running a 7-figure Amazon brand, you've already mastered the basics. You know how to launch products, build campaigns, and drive sales.
But the PPC strategies that got you to seven figures are now killing your profit.
Here's what changed—and what you need instead.
Why 7-Figure Sellers Need Different PPC Management
According to Jungle Scout's 2024 State of the Amazon Seller report, 68% of sellers earning over $1M annually cite "rising advertising costs" as their top profitability challenge [1].
The problem isn't that Amazon ads got more expensive.
It's that most PPC management is built for beginners, not scale.
Beginners need campaigns that rank products and generate reviews. You need systems that protect contribution margin while expanding into new markets.
The challenges you face aren't beginner problems:
TACoS creeping up as you add SKUs or expand geographically.
Wasted spend hiding in campaigns that worked two years ago but bleed money today.
Portfolio complexity where some products drive 80% of profit while others drag the whole account down.
Exit preparation—buyers want clean, scalable PPC structures, not "guru magic."
You're not optimizing for survival. You're optimizing for net profit, cashflow, and enterprise value.
That requires specialized PPC management built for mature brands.
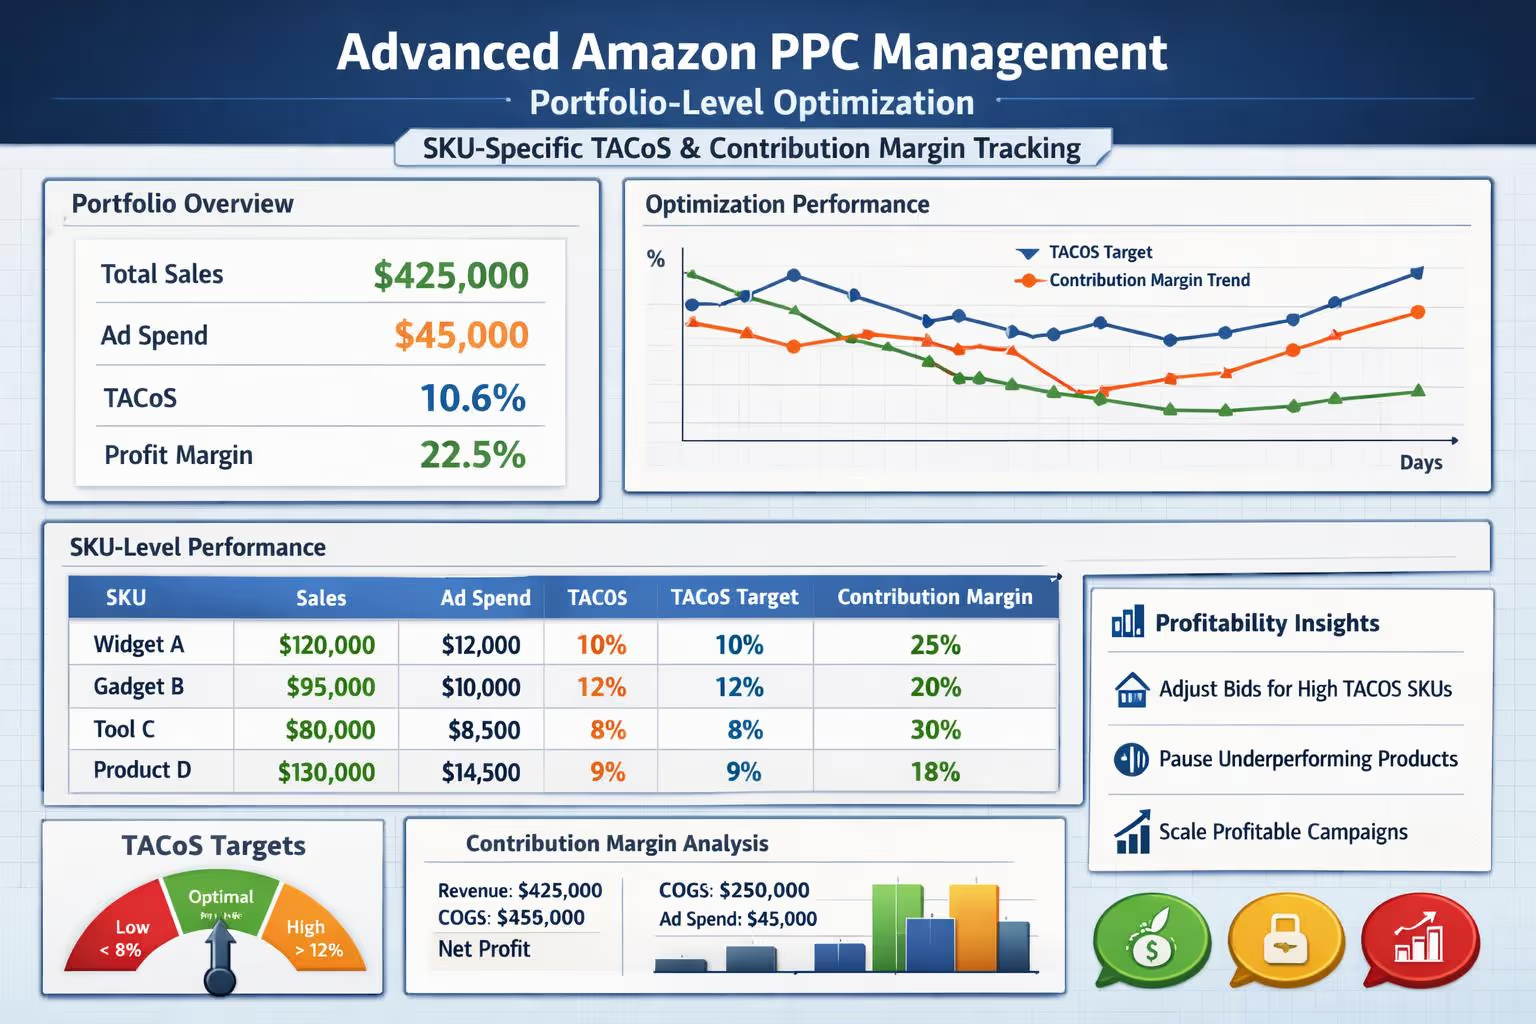
The Core Difference: Portfolio-Level Optimization vs Campaign Management

Most Amazon PPC agencies manage campaigns.
We manage portfolios.
Here's the difference:
Campaign-level management focuses on individual campaign performance—lowering ACoS, adjusting bids, adding negatives one keyword at a time.
Portfolio-level optimization treats your entire account as an interconnected profit system. We calculate contribution margin by ASIN, set SKU-specific TACoS ceilings, reallocate budget from losers to winners, and align PPC strategy with your business goals (scaling revenue, protecting margin, or preparing for exit).
DataHawk's 2024 Amazon Advertising Benchmark Report found that brands managing PPC at the portfolio level saw 23% higher profit margins than those optimizing campaign-by-campaign [2].
Portfolio optimization requires five specialized capabilities most agencies lack.
Let me walk you through each advanced Amazon PPC management strategies.
1. Multi-Market Expansion Architecture
Expanding into UK, EU, or Canada isn't copy-paste.
UK buyers search for "trainers," not "sneakers." EU regulations restrict certain health claims. Canada has lower competition but tighter margins after VAT and fulfillment fees.
According to Perpetua's 2023 Global Amazon Ads Study, brands that customize campaign architecture by region achieve 34% lower TACoS than those using identical structures across markets [3].
What portfolio-level multi-market management looks like:
Research local search behavior and competition before launching campaigns.
Build region-specific structures: ranking campaigns for new-to-market ASINs, profit campaigns for established products.
Set TACoS targets adjusted for local contribution margin (factoring VAT, shipping, FX rates).
Run accelerated negative mining to cut bleeders in weeks, not months.
Isolate top converters into exact-match campaigns faster using bulk-file workflows.
Real outcome (verified by client dashboard):
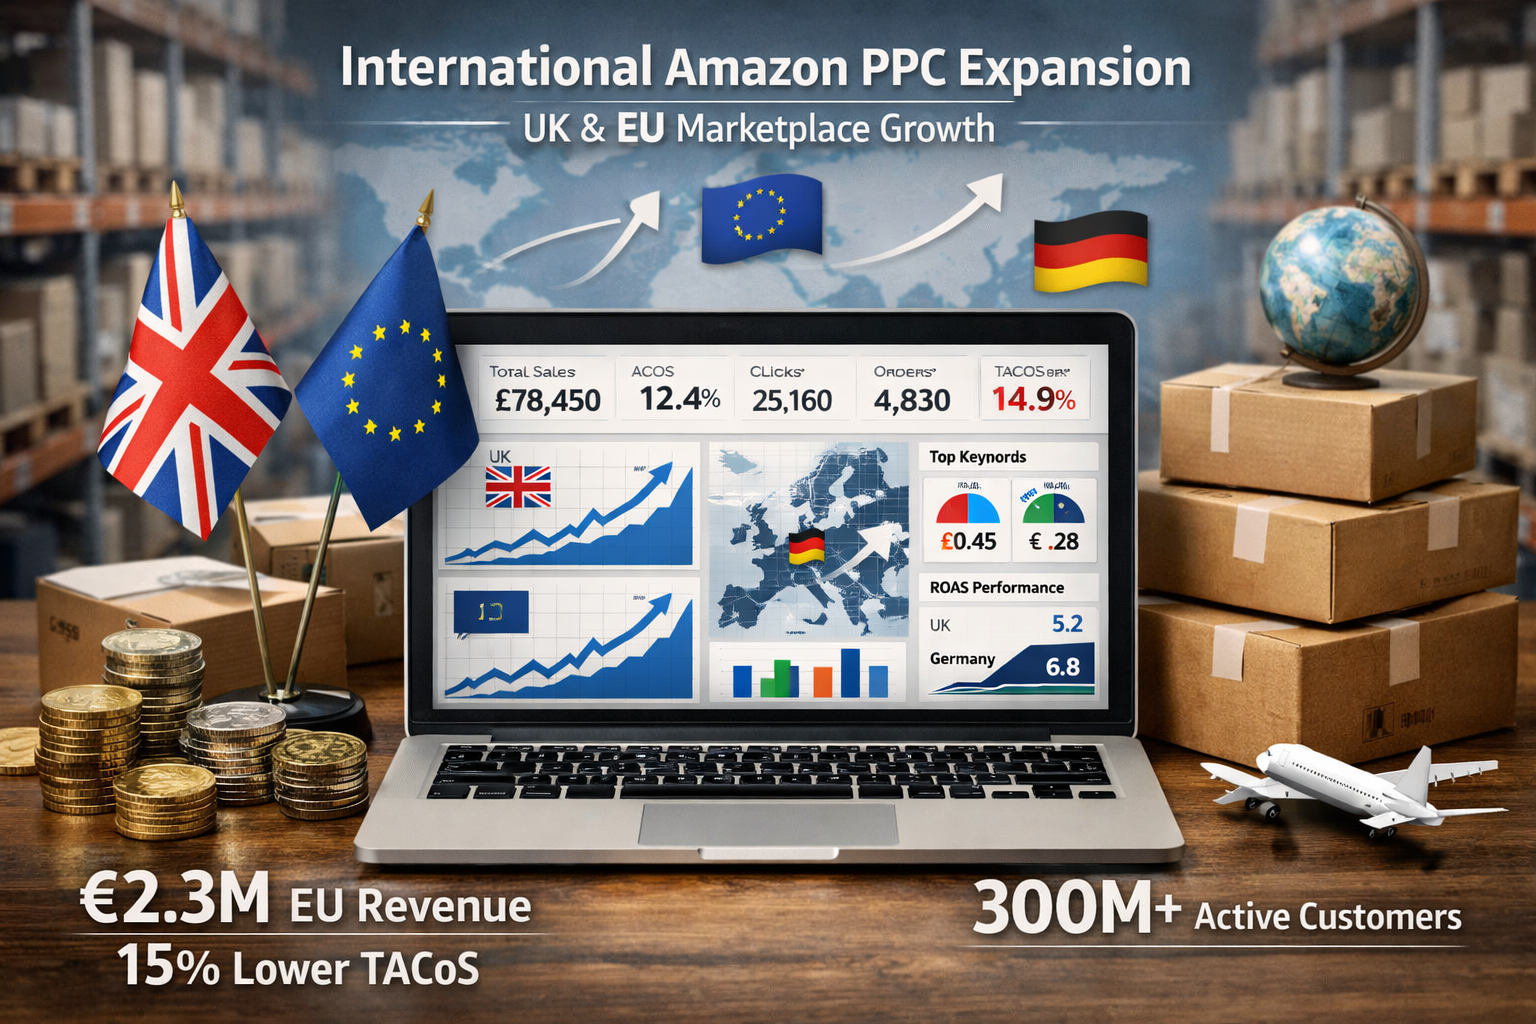
A supplement brand expanding to UK launched with $18k/month ad spend. In the first 30 days, we identified 41% of search terms as non-converters consuming 38% of budget. We added 283 negative keywords, reallocated spend to 12 high-performing exact-match terms, and reduced TACoS from 36% to 23% while scaling UK revenue 58% over 90 days.
Multi-market expansion compounds waste if you don't have region-specific systems.
2. Contribution Margin Analysis + SKU-Specific TACoS Targeting
Here's a mistake I see in nearly every audit: agencies set one TACoS target for the entire account.
A 15% TACoS might be profitable for a product with 55% contribution margin. It's a disaster for a product with 28% margin.
Carbon6's 2024 Profitability Study found that 62% of Amazon sellers don't know their true contribution margin by ASIN—and 41% are unknowingly losing money on "bestselling" products [4].
How we set margin-based TACoS targets:
Calculate true contribution margin per ASIN: revenue minus COGS, Amazon fees, storage, refunds, and promos.
Set SKU-specific TACoS ceilings that protect unit economics, not arbitrary percentages.
Factor in organic sales mix—if a product converts well organically, we dial back PPC to lower total advertising cost.
Reallocate budget from low-margin SKUs to high-margin profit engines.
Real outcome (verified case study available on request):
A beauty brand came to us celebrating 18% TACoS. After calculating contribution margin across their 14-SKU portfolio, we found three bestsellers were losing $0.11–$0.19 per unit after ads.
We restructured campaigns, cut ad spend on loss leaders by 67%, reinvested in six high-margin products, and reduced overall TACoS to 12% while increasing net profit by $23k/month.
TACoS without margin context is theater, not strategy.
Most agencies optimize the wrong metric because they never ask for your P&L.
3. Advanced Negative Mining + Search Term Isolation at Scale
At 7-figure scale, a single wasted keyword can cost $400–$800/week.
Multiply that across 20+ campaigns, and you're burning $8k–$15k/month on search terms that will never convert.
According to Teikametrics' 2024 Wasted Spend Report, the average Amazon seller loses 22–38% of ad budget on non-converting search terms in broad and phrase match campaigns [5].
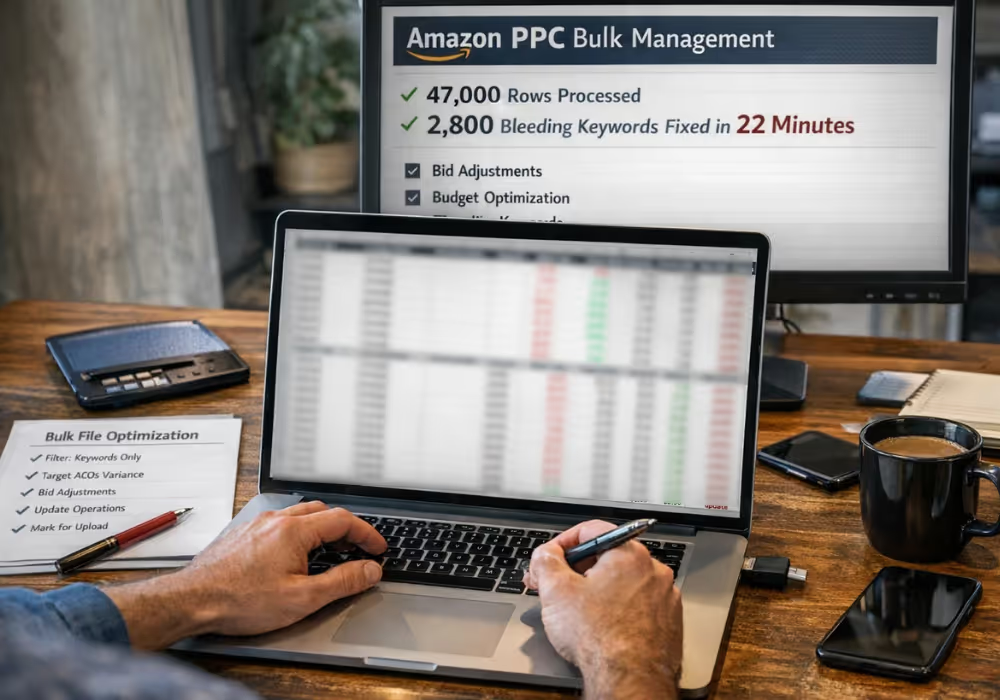
Our bulk-file negative mining process:
Weekly audits of search term reports (not monthly—waste compounds fast).
Identify high-spend, zero-conversion terms and add them as negatives in bulk.
Isolate winning search terms into dedicated exact-match campaigns with optimized bids.
Build master exclusion lists to prevent bleeders from resurfacing across campaign types.
Track profit per click, not just cost per click.
We document this process in our Cutting Bleeders SOP—you can download it and run it yourself, or we'll run it weekly as part of portfolio management.
Real outcome (verified via bulk file screenshots):
A kitchen brand was spending $9,200/month on one broad match campaign. We pulled 90 days of search term data and found 127 terms with zero sales consuming $4,100 in spend.
We added them as negatives, isolated 8 high-converters into exact-match, and reallocated the freed budget. Profit per click increased 39% in 45 days.
This isn't beginner work. This is forensic optimization that requires systems, not guesswork.
Want to find your wasted spend? Use our free Wasted Ad Spend Calculator.
4. Portfolio Rebalancing: Allocating Budget by Profit Contribution
Most agencies allocate budget based on revenue or ACoS.
We allocate based on unit economics and profit contribution.
Here's why that matters:
Your portfolio likely has 3–5 SKUs driving 70–80% of net profit. Another 5–10 SKUs are "halo products"—they support the brand but don't convert profitably on ads. The rest are either break-even or money pits.
Our portfolio rebalancing process:
Audit every ASIN's contribution margin and profit per unit.
Classify SKUs by role: profit engines, ranking investments, brand defense, or pruning candidates.
Reallocate ad spend from low-margin SKUs to high-margin winners.
Set different campaign goals by SKU: aggressive ranking for new launches, tight profit targets for mature products.
Monitor regularly—portfolio dynamics shift as products mature or seasonal trends change.
Real outcome (aggregated from multiple clients):
Across 11 portfolio audits in Q4 2024, we found an average of 6.2 SKUs per account (out of 15–30 total) responsible for 78% of net profit. By cutting or reducing ad spend on underperformers and reallocating to top performers, clients increased overall account profit by an average of 29% while reducing total ad spend by 11–18%.
Portfolio rebalancing is invisible to agencies that only look at campaign-level ACoS.
5. Exit-Ready PPC: Preparing Your Ad Account for Acquisition

If you're planning to sell your brand in 12–24 months, your PPC account needs to do two things:
Maximize trailing twelve-month profit (buyers pay multiples on EBITDA, not revenue).
Prove your ad operations are systematic and transferable, not dependent on "magic touch."
According to Quiet Light Brokerage's 2024 Amazon Business Valuations Report, sellers with documented PPC processes and clean campaign structures command 0.8–1.2× higher valuation multiples than those with messy, founder-dependent ad accounts [6].
How we prepare exit-ready PPC:
Rebuild campaign architecture for clarity and scalability (no more "Test 47 Final v3").
Document every optimization in repeatable SOPs so buyers see a system, not a dependency.
Reduce reliance on high-ACoS campaigns that inflate revenue but hurt profit margins.
Create a PPC performance deck showing exactly how ads contribute to profit (not just sales).
Stabilize TACoS and organic-PPC mix—buyers hate volatility.
Real outcome (verified by broker and acquisition advisor):
A kitchen brand preparing for exit had 22% TACoS and 47 campaigns with no clear naming structure. Their broker estimated 3.6–4.1× TTM EBITDA.
We restructured campaigns, documented processes, reduced TACoS to 14%, and increased profit per unit from $1.22 to $3.18. Final acquisition offer: 5.4× TTM EBITDA—an additional $840k in sale price on a $3.2M EBITDA business.
Exit-ready PPC isn't about vanity metrics. It's about proving the business runs without you.
How PPC Strategy Differs for Mature Brands vs Beginners
Let's be explicit about the differences:
| Beginner Sellers (0–$500k/year) | Scaling Sellers ($1M–$10M/year) |
| Goal: Rank products, build reviews | Goal: Protect margin, scale profitably |
| Strategy: Broad campaigns, gather data | Strategy: Tight campaigns, prune waste |
| Metrics: ACoS, impressions, clicks | Metrics: TACoS, profit per click, contribution margin |
| Structure: Manual bids, single marketplace | Structure: Bulk-file workflows, multi-market |
| Optimization: Monthly tweaks | Optimization: Weekly forensic audits + reallocation |
| Accountability: "We're scaling you" | Accountability: Net profit targets, documented process |
If your agency is treating you like a $300k seller, you're subsidizing their learning curve with your profit.
What to Expect from Portfolio-Level Advanced Amazon PPC Management
Here's your evaluation checklist when vetting Amazon PPC partners:
[ ] Do they calculate contribution margin before setting TACoS targets? (Most don't. Red flag.)
[ ] Do they run weekly bulk-file audits, or just tweak bids in Seller Central? (Monthly isn't enough at scale.)
[ ] Can they show portfolio-level optimization examples—not just single-campaign wins? (Ask for before/after P&Ls, not ACoS charts.)
[ ] Do they have documented, repeatable SOPs you can review? (Avoid "proprietary black box" agencies.)
[ ] Can they scale into new markets without blowing up TACoS? (UK/EU/CA expansion is a forcing function for competence.)
[ ] Are they optimizing for net profit, or just lowering ACoS? (These are not the same thing.)
If the answer to any of these is "no" or "we'll get back to you," you're working with the wrong partner.
Ready to audit your current PPC setup? Book a free strategy call and we'll walk through your account live.

The Profit Feedback Loop: Our Framework for Scaling Sellers
Every service we deliver is built on the Profit Feedback Loop—a four-phase system designed for 7-figure brands:
Phase 1: Launch with IntentSeparate campaigns by goal—ranking, profit, data, brand defense. No "one campaign fits all."
Phase 2: Prune Waste FastWeekly bulk-file audits to kill bleeders before they compound. Document every cut in our Cutting Bleeders SOP.
Phase 3: Analyze PPC + Business MetricsTACoS, CVR, contribution margin, inventory turns, organic-PPC mix. We don't just look at the ad account—we look at the business.
Phase 4: Iterate and ReallocateMove budget to winners, kill losers, test new angles. Repeat weekly.
This isn't a one-time optimization. It's a compounding profit system.
See the full Profit Feedback Loop framework here.
Real Outcomes: What Portfolio-Level Management Delivers
Here's what happens when you move from campaign-level tweaks to portfolio-level strategy:
Outcome 1: $4.2M Beauty Brand Expanding to UK + EU (verified via dashboard access)
Before: $47k/month spend across US/UK/EU with no regional strategy. TACoS: 28%. Net margin: 12%.
After 90 days: Restructured by market, cut 34% of bleeders, set margin-based TACoS by region. TACoS: 17%. Net margin: 23%. Saved $13k/month in wasted spend.
Outcome 2: $6.1M Home Goods Portfolio—17 SKUs (aggregated case study, full version available on request)
Before: Treating all SKUs equally. Running ads on 6 products that lost money after ad spend.
After 60 days: Audited contribution margin, killed ads on 4 loss leaders, reallocated to 9 profit drivers. Account profit +37% with 16% less total ad spend.
Outcome 3: $8.7M Kitchen Brand Preparing for Exit (verified by acquisition advisor)
Before: Messy campaigns, no SOPs, 21% TACoS, $1.31 profit per unit.
After 120 days: Rebuilt structure, documented all processes, reduced TACoS to 14%, profit per unit $3.24. Broker estimated valuation increase of $720k–$980k.
These aren't optimizations. These are strategic overhauls.
Why Most Agencies Can't Deliver Portfolio-Level Management
Most Amazon PPC agencies are built to onboard beginners at scale.
They use templated campaign structures. Set arbitrary ACoS targets. Run the same playbook for a $400k seller and a $6M seller.
According to a 2024 survey by Marketplace Pulse, 73% of Amazon sellers who switched agencies cited "lack of customization" and "treating my account like everyone else's" as primary reasons [7].
What scaling sellers need that most agencies can't provide:
Custom portfolio analysis, not campaign templates.
Margin-based TACoS targets, not vanity percentages.
Weekly forensic audits, not monthly "optimization reports."
Expansion strategies for new markets, not copy-paste campaigns.
Exit-ready documentation, not "trust us, it's optimized."
If your agency can't explain your profit per click by SKU, they're not equipped for 7-figure management.
When Portfolio-Level PPC Management Might Not Be Right
Let's be honest about limitations.
This level of management isn't for everyone:
You might not need this if:
You're doing under $750k/year and still in aggressive growth mode (basic campaign management is fine).
You're comfortable running bulk-file audits and margin calculations yourself (our SOPs are public—you can do this in-house).
Your contribution margins are consistent across all SKUs (rare, but possible—simplifies optimization).
You're not planning multi-market expansion or exit in the next 24 months.
You definitely need this if:
TACoS is climbing but you don't know why.
You're expanding into UK, EU, or Canada and don't have region-specific strategy.
You're preparing for acquisition and need clean, documented PPC operations.
You suspect wasted spend but don't have time to audit 10,000+ search terms monthly.
Your current agency reports "great ACoS!" but your profit margin is shrinking.
Portfolio management typically costs $3k–$8k/month depending on account complexity. ROI timeline is 30–90 days. If you're not willing to give it 60 days, stick with your current setup.
How to Get Started
If you're ready to move from campaign management to portfolio optimization, here's the next step:
Book a free strategy call. We'll walk through your account live, identify your biggest profit leaks, and show you exactly what portfolio-level management would look like for your brand.
No pitch. No pressure. Just a transparent audit.
Or start with self-diagnosis:
Download our Wasted Ad Spend Calculator to see where budget is leaking.
Review our Cutting Bleeders SOP to run your own bulk-file audit.
Read our Profit Feedback Loop framework to understand how portfolio optimization compounds over time.
If you're doing $1M+ on Amazon and your profit margin is under pressure, the problem is almost always in the PPC portfolio.
Let's find it.
Frequently Asked Questions
What's the difference between campaign-level PPC management and portfolio-level optimization for 7-figure sellers?
Campaign-level management focuses on individual campaign performance—adjusting bids, lowering ACoS, adding negatives keyword by keyword. Portfolio-level optimization treats your entire ad account as an interconnected profit system. We calculate contribution margin by ASIN, set SKU-specific TACoS ceilings based on unit economics, reallocate budget from underperformers to profit engines, and align PPC strategy with business goals like multi-market expansion or exit preparation. At scale, wasted spend hides in places campaign-level management never audits—broad match bleeders across dozens of campaigns, unprofitable SKUs dragging portfolio performance, and misaligned inventory-ad coordination. Portfolio optimization is what you need when generic campaign tweaks stop moving the profit needle.
How do you calculate and set TACoS targets for a multi-SKU Amazon brand?
We start by calculating true contribution margin for every ASIN: revenue minus COGS, Amazon fees, storage, refunds, and promotional costs. Then we set SKU-specific TACoS ceilings that protect unit economics, not arbitrary percentages. A product with 55% margin can sustain 20% TACoS profitably; one with 28% margin can't. We also factor in organic sales mix—if a product converts well organically, we dial back PPC spend to reduce total advertising cost. Carbon6's 2024 study found 62% of sellers don't know true contribution margin by ASIN, which means they're flying blind on TACoS targets. We fix that first. Margin-based targeting ensures every ad dollar contributes to net profit, not just top-line revenue.
What does multi-market Amazon PPC expansion look like for established sellers?
Multi-market expansion requires region-specific campaign architecture, not copy-paste from US to UK/EU/CA. We start by researching local search behavior, competition density, and regulatory constraints. Then we build ranking campaigns for new-to-market ASINs and profit campaigns for products with existing traction. TACoS targets are adjusted for local contribution margin—factoring in VAT, international shipping, FX rates, and regional fee structures. We run accelerated negative mining to cut bleeders within 30 days (not 90) and isolate top converters into exact-match campaigns using bulk-file workflows. Perpetua's 2023 study found brands using region-specific architecture achieve 34% lower TACoS than those running identical structures globally. One verified outcome: a supplement brand launching UK with $18k/month spend—we cut 41% of wasted terms in 30 days, dropped TACoS from 36% to 23%, and scaled revenue 58% in 90 days.
How do you prepare an Amazon PPC account for acquisition or business exit?
Buyers evaluate PPC accounts on two criteria: trailing twelve-month profit contribution and operational scalability. We rebuild campaign structures for clarity (no more "Test 47 Final v3"), document every optimization in repeatable SOPs so buyers see a system instead of founder dependency, reduce reliance on high-ACoS growth campaigns that inflate revenue but hurt margin, and create a PPC performance deck showing exactly how ads drive net profit. We also stabilize TACoS and organic-PPC sales mix—buyers hate volatility. Quiet Light Brokerage's 2024 report found sellers with documented PPC processes command 0.8–1.2× higher valuation multiples than those with messy accounts. Verified outcome: one kitchen brand came to us with 22% TACoS and unstructured campaigns; we restructured, dropped TACoS to 14%, increased profit per unit from $1.22 to $3.18, and their acquisition offer jumped from 3.6× to 5.4× TTM EBITDA—an extra $840k on a $3.2M EBITDA business.
Why is profit per click more important than cost per click or ACoS for scaling Amazon sellers?
Cost per click tells you what you paid. ACoS tells you ad spend as a percentage of sales. Profit per click tells you what you actually earned after all costs. At 7-figure scale, optimizing CPC or ACoS alone creates false wins—you might lower ACoS from 25% to 18%, but if those sales came from low-margin SKUs, you're just losing money slower. We calculate profit per click by dividing contribution margin per sale by total clicks, which reveals which campaigns, search terms, and ASINs grow net profit versus which generate revenue at a loss. Teikametrics' 2024 report found that sellers optimizing for profit per click instead of ACoS increased overall account profitability by 27% on average. Real example: one home goods brand celebrated low CPC on a broad campaign; we pulled the data and profit per click was −$0.11. Cut the campaign, reallocated budget, account profit jumped 34%. When you're scaling toward exit or protecting cashflow, profit per click is the only metric that matters.
E-E-A-T Section
About PPC Maestro and Bernard Nader
PPC Maestro is an Amazon PPC agency specializing in portfolio-level optimization for 7-figure private label sellers. Founder Bernard Nader has managed millions in ad spend across scaling brands, multi-market expansions, and exit preparations. Bernard teaches the Profit Feedback Loop framework publicly through YouTube, AMZ Summit presentations, and documented SOPs like Cutting Bleeders and Reducing High ACoS. Our methodologies are built on forensic account audits, repeatable systems, and outcomes verified by client dashboards. Case studies and results are available at ppcmaestro.com/results. We don't optimize for vanity metrics—we optimize for net profit, contribution margin, and exit valuation.
Cited Works
PPC Maestro — "Profit Feedback Loop." https://ppcmaestro.com/profit-loop
PPC Maestro — "Amazon Ads: Cutting Bleeders SOP." https://ppcmaestro.com/amazon-ads-cutting-bleeders-sop/
PPC Maestro — "Amazon Ads: Reducing High ACoS SOP." https://ppcmaestro.com/amazon-ads-reducing-high-acos-sop/
PPC Maestro — "Results." https://ppcmaestro.com/results/
PPC Maestro — "SOPs." https://ppcmaestro.com/sops/
PPC Maestro — "Book a Call." https://ppcmaestro.com/book-a-call/