Last week I audited a $3.2M seller's account. His ACoS was a pristine 14%. His agency was high-fiving themselves.
His contribution margin? 9%.
Every sale was making him poorer. He was sprinting on a treadmill toward bankruptcy and didn't even know it.
This is the silent killer in Amazon PPC. Sellers obsess over ACoS like it's the only metric that matters. Meanwhile, their actual profit—the money they get to keep—is evaporating.
Here's the truth most agencies won't tell you: ACoS is a vanity metric. Contribution margin is where real profit lives.
And if you're a 7-figure seller planning an exit in the next 12-24 months, understanding this distinction could be worth hundreds of thousands of dollars.
What Is Contribution Margin (And Why It Matters More Than ACoS)
Let's start with the math that actually matters.
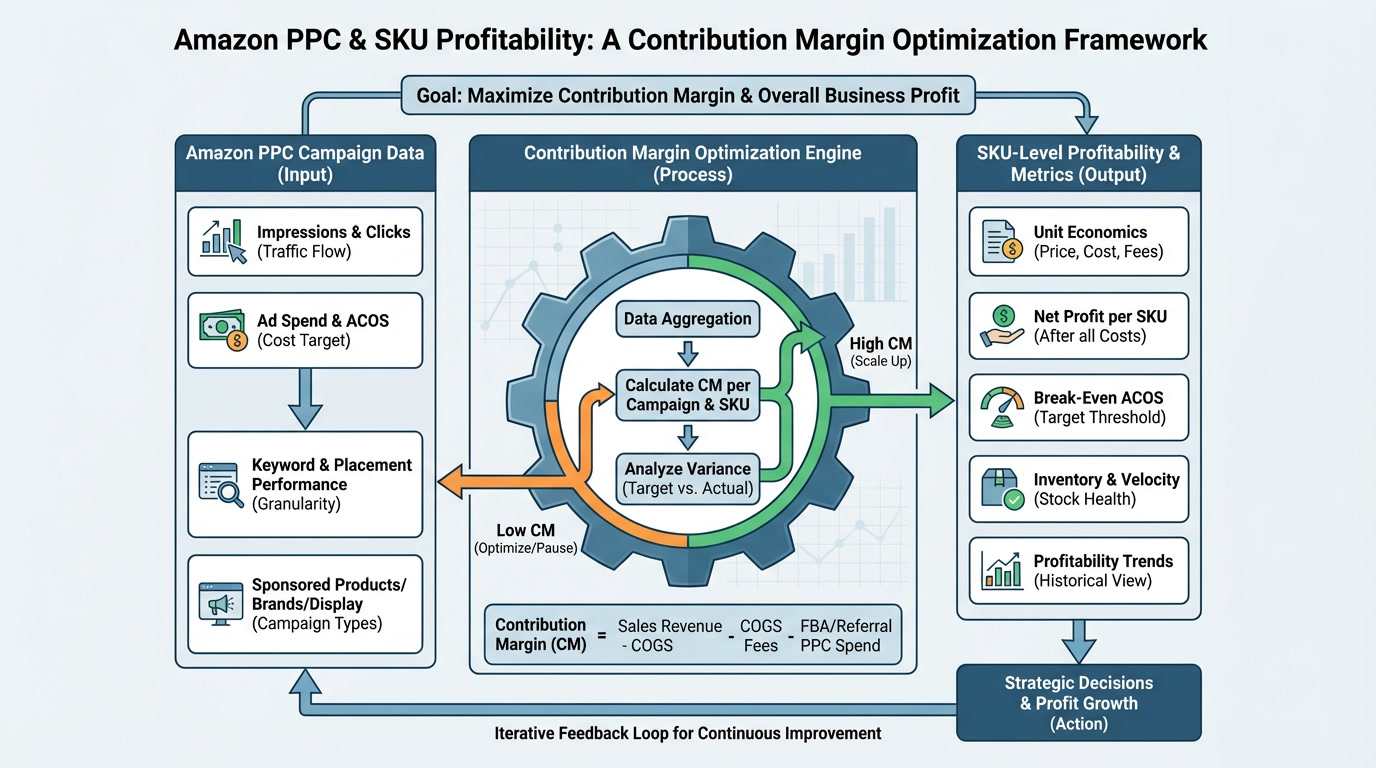
Contribution Margin = Revenue - (COGS + Amazon Fees + PPC Spend)
That's it. Simple formula. Massive implications.
A quick clarification on "Amazon Fees"—this must include all variable costs Amazon charges you per unit:
Referral fees (typically 15% of sale price)
FBA fulfillment fees (pick, pack, ship)
Storage fees (monthly and long-term)
Returns processing costs (deduct refunds from revenue or treat as a cost line)
Miss any of these and your CM calculation is fiction.
Your contribution margin tells you exactly how much profit each sale contributes toward covering your fixed costs and generating actual take-home profit. Not "profit before ads." Not "gross margin." Real money.
Research from Titan Network shows that 7 and 8-figure Amazon sellers need 20-30% contribution margin for sustainable scaling [1]. Drop below 12% CM, and you're not building a business. You're building a stress machine that makes you busier without making you richer.
Here's what most sellers get wrong: they celebrate low ACoS without checking whether that low ACoS actually produces profit.
A 10% ACoS means nothing if your margins are already razor-thin. You could have the "best" ACoS in your category and still lose money on every unit sold.

The ACoS Trap: How "Good" Metrics Hide Bad Economics
I see this constantly in audits. Sellers come to me proud of their ACoS numbers, completely blind to their contribution margin disaster.
Let me show you how this plays out in reality.
Product A:
ACoS: 15%
Contribution Margin: 35%
Verdict: Scale aggressively
Product B:
ACoS: 12%
Contribution Margin: 8%
Verdict: Losing money at scale
Traditional PPC advice says scale Product B. Lower ACoS = better performance, right?
Wrong.
Product B has better "efficiency" metrics but worse profit metrics. Every dollar you pour into Product B's ads generates negative returns at scale. You're literally paying Amazon to lose money faster.
Product A, with its "worse" ACoS, is actually your profit engine. That extra 3% in ACoS is buying you 27 percentage points of contribution margin. That's the trade you want to make.

TACoS vs. Contribution Margin: Understanding the Relationship
Here's where it gets nuanced. TACoS (Total Advertising Cost of Sale) measures ad spend against total revenue, not just attributed sales. It's useful for understanding advertising dependency.
But TACoS alone doesn't tell you if you're profitable.
A 15% TACoS on a product with 45% gross margin leaves you 30% contribution margin. Healthy.
A 15% TACoS on a product with 22% gross margin leaves you 7% contribution margin. Dying slowly.
Same TACoS. Radically different outcomes.
This is why I built the Profit Feedback Loop—to force sellers to evaluate campaigns by what actually matters: profit per click, not cost per click.
Want to know where your profit is actually hiding? Book a call and we'll identify your highest-margin opportunities in the first 15 minutes.
The 4-Step Contribution Margin Optimization Framework
Enough theory. Here's exactly how to fix this in your account.
Step 1: Calculate Contribution Margin Per SKU
This is where most sellers get stuck. They know they should calculate CM but don't know where to find the data.
Here's exactly where to pull each component in Seller Central:
For Revenue (per ASIN):Navigate to Reports > Business Reports > Detail Page Sales and Traffic by Child Item. Export this report for the last 90 days. You want the "Ordered Product Sales" column.
For Amazon Fees (per ASIN):Go to Reports > Payments > All Statements. Download your settlement report—this shows actual fees deducted per transaction. Alternatively, use the Revenue Calculator in Seller Central to estimate per-unit fees for each ASIN.
For PPC Spend (per ASIN):Navigate to Advertising > Campaign Manager > Reports. Create a "Sponsored Products" report with "ASIN" as a column. This shows exactly how much you spent advertising each product.
For COGS:This comes from your own records—supplier invoices, landed cost calculations, etc. Amazon doesn't track this for you.
Now calculate for each SKU:
CM = Unit Revenue - (Unit COGS + Unit Amazon Fees + Unit PPC Cost)
Don't estimate. Don't average across your catalog. Calculate this per SKU because your products have wildly different unit economics.
A seller I worked with last quarter discovered his "best-selling" product had 6% CM while a slower mover had 42% CM. He'd been pouring budget into the wrong product for 18 months.
Pro tip: Build a spreadsheet that pulls from these three data sources weekly. The manual matching is tedious the first time, but it's the only way to see reality.
Step 2: Segment Your SKUs Into Three Tiers
Once you have CM calculated, sort your catalog:
| Tier | Contribution Margin | Strategy |
| High-CM | 30%+ | Scale aggressively, accept higher ACoS |
| Medium-CM | 15-30% | Maintain, optimize for efficiency |
| Low-CM | Below 15% | Reduce spend or discontinue |
This segmentation changes everything about how you allocate budget.
High-CM products can absorb more aggressive bidding, higher TACoS, and experimental campaigns. You have margin to work with.
Low-CM products need surgical precision or, honestly, a hard conversation about whether they belong in your catalog at all.

Step 3: Reallocate PPC Budget to High-CM SKUs
This is where most sellers need to completely rewire their thinking.
Your high-CM products should get more budget even if their ACoS is higher than your low-CM products.
Read that again.
I recently helped a seller shift $15k/month from a 14% ACoS, 11% CM product to a 22% ACoS, 38% CM product. His total revenue dropped 8%. His profit increased 31%.
That's the math that matters.
Your TACoS targets should be set by product margin, not by arbitrary benchmarks. A 25% TACoS on a 50% CM product is vastly more profitable than a 10% TACoS on a 15% CM product.
Step 4: Make Hard Decisions on Low-CM SKUs
Here's where most sellers get stuck. They can't bring themselves to cut losers.
If a SKU has contribution margin below 15%, you have three options:
Option 1: Reprice Upward
Test higher price points to improve margin. Here's the counterintuitive truth: raising your price by $2-3 might drop conversion rate by 10-15%, but if it doubles your contribution margin, you come out ahead.
Run the math before you dismiss this. A product selling 100 units/month at $25 with 12% CM generates $300 profit. That same product selling 85 units/month at $28 with 24% CM generates $571 profit.
Less volume. More money.
Price elasticity varies by category, but most sellers underprice because they're terrified of losing the Buy Box or rank. Test it. The data might surprise you.
Option 2: Renegotiate COGS
Work with suppliers to reduce unit costs. Commit to larger orders. Find alternative suppliers. Every dollar you save on COGS flows directly to CM.
Option 3: Discontinue
Stop lighting money on fire.
I worked with a 7-figure seller who was terrified to cut 12 SKUs. Those 12 products represented 35% of his revenue but generated negative profit contribution. After we cut them, his revenue dropped 30% but his profit doubled.
Less revenue. More profit. Simpler business.
That's the trade most sellers are too scared to make.
Why This Matters for Exit Planning
If you're building toward an exit, contribution margin isn't just important—it's everything.
Buyers don't pay premiums for revenue. They pay premiums for predictable, high-margin cash flow [2].
A business doing $5M with 32% contribution margin is worth dramatically more than a business doing $8M with 12% contribution margin. The first business has room to invest in growth. The second is one Amazon fee increase away from collapse.
Smart acquirers look at unit economics before they look at top-line revenue. They run the same CM analysis I just walked you through. And when they see a catalog full of low-margin products propped up by aggressive PPC, they either walk away or slash their offer.
High contribution margin across your catalog signals operational excellence. It tells buyers you understand your business at the unit level and can maintain profitability through market changes.
That's what commands premium multiples.
The Metrics That Actually Matter
Stop obsessing over ACoS in isolation. Start tracking these metrics instead:
Contribution Margin per SKU – Your north star metric for catalog decisions
Profit Per Click – How much actual profit each ad click generates
TACoS by Product Tier – Different targets for different margin profiles
CM-Weighted ROAS – Return on ad spend adjusted for product profitability
I've built systems and SOPs specifically to track these metrics because the standard Amazon reporting doesn't surface them. You have to engineer visibility into your own profitability.
When you shift from ACoS-first to CM-first thinking, everything changes. Campaign decisions get clearer. Budget allocation becomes obvious. And profit stops being an accident.

Get Your Contribution Margin Analysis
Most 7-figure sellers have never calculated contribution margin at the SKU level. They're flying blind, making budget decisions based on incomplete data.
If you want to know exactly which products are actually profitable—and which ones are quietly bleeding your account dry—book a call to discuss a profit-first audit.
We'll map contribution margin across your catalog, identify reallocation opportunities, and build a PPC strategy that optimizes for what matters: profit.

Frequently Asked Questions
What's the difference between contribution margin and gross margin?
Gross margin only accounts for COGS and Amazon fees—it shows profit before advertising costs. Contribution margin includes PPC spend, giving you the true profit picture after advertising. A product with 40% gross margin but 10% contribution margin is unprofitable to advertise aggressively. CM tells you what you actually keep after the full cost of acquiring that sale.
How often should I recalculate contribution margin?
Monthly at minimum, weekly if you're actively optimizing campaigns. COGS, Amazon fees, and PPC efficiency all fluctuate. A product that had 30% CM last quarter might have 18% CM now due to increased competition, fee changes, or supplier cost increases. Regular recalculation prevents decisions based on stale data. Build a recurring calendar reminder.
Can I have good ACoS and bad contribution margin simultaneously?
Absolutely—this is the most common trap I see in audits. If your product has thin margins to begin with, even an "excellent" 12% ACoS can result in negative contribution margin. ACoS is just one input in the CM formula. It measures advertising efficiency but says nothing about whether you're actually profitable after all costs are deducted.
What contribution margin should I target before scaling PPC?
Aim for minimum 25% CM before aggressive scaling. Below 20%, you have very little room for error—one algorithm shift, fee increase, or competitor price war can flip you negative. Above 30% gives you flexibility to test new campaigns, accept higher ACoS during ranking pushes, and absorb market fluctuations without panicking.
Should I stop advertising low contribution margin products entirely?
Not necessarily. Low-CM products might serve strategic purposes like defending market share, cross-selling to higher-margin products, or maintaining catalog breadth for brand perception. But they shouldn't receive disproportionate budget. Evaluate whether the strategic value justifies the profit drag. If you can't articulate a clear strategic reason, reallocate that spend to your high-CM winners.
About PPC Maestro
PPC Maestro is led by Bernard Nader, a profit-first Amazon PPC specialist who has managed millions in ad spend for 7 and 8-figure private label sellers. Bernard built the Profit Feedback Loop framework after seeing too many sellers celebrate vanity metrics while their actual profit disappeared. His systems and SOPs are designed to optimize for contribution margin and sustainable growth—not ACoS theater. Bernard regularly shares strategies through case studies, YouTube tutorials, and speaking engagements, helping sellers transform their ad accounts from cost centers into profit engines.
Works Cited
[1] Titan Network — "Amazon Seller Profitability Benchmarks."
https://titannetwork.com/
[2] Empire Flippers — "What Buyers Look for in Amazon FBA Businesses." https://empireflippers.com/