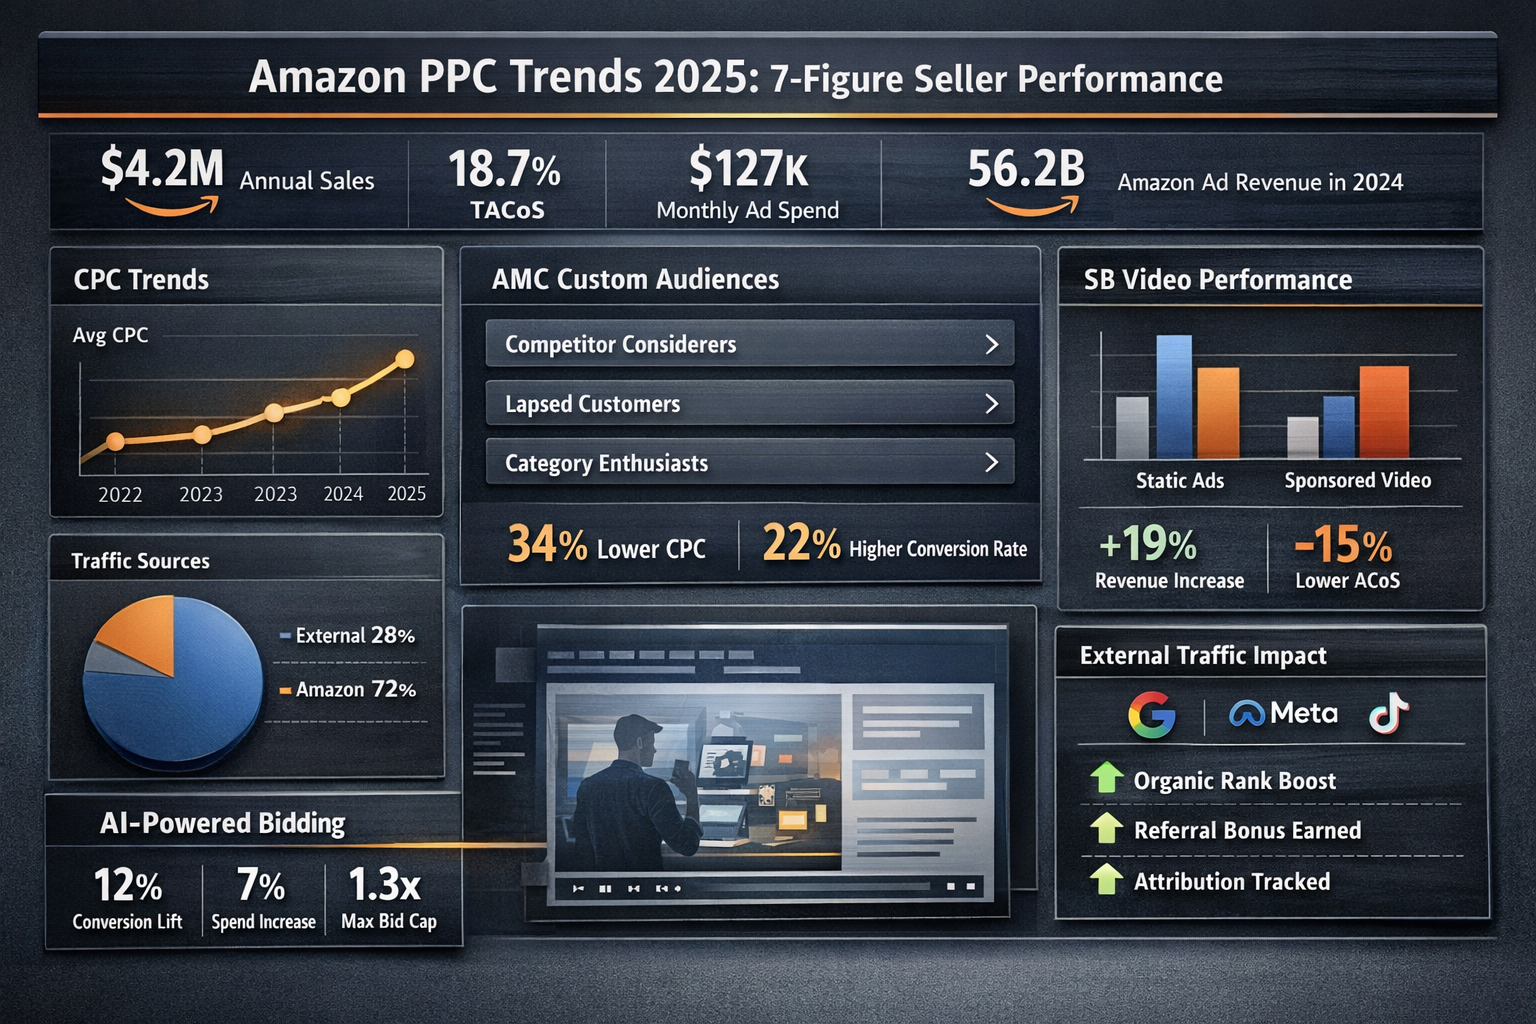
I pulled a search term report last week for a seller doing $4.2M annually. Looked profitable on paper. Then I ran the unit economics on their top 50 SKUs.
Eighteen of them were losing money on every single sale.
Not "underperforming." Not "needs optimization." Losing actual cash—while the owner celebrated "record revenue."
This is what happens when you scale without knowing your real breakeven. You're not building a business. You're funding Amazon's growth with your margin.
A unit economics calculator for Amazon PPC isn't optional for 7- and 8-figure sellers. It's the difference between scaling into profit and scaling into a wall.
Let me show you exactly how to build one.
Why Total Profit Masks the Real Problem
Here's the trap most sellers fall into.
Account-level profit looks healthy. TACoS seems reasonable. So you keep spending.
But inside that "profitable" account? Individual SKUs are bleeding. High-margin winners are subsidizing money pits. And you're pouring ad dollars into products that can't mathematically turn a profit.
I've audited accounts where 30% of ad spend was going to SKUs with contribution margins under 12%. That's not advertising. That's charity.
The data is clear: sellers scaling to 7-8 figures need per-SKU clarity. Anything less is guessing with six figures on the line [1].
The benchmark you need to hit: 20-30% contribution margin per SKU for sustainable scaling. Drop below 12%, and your unit economics are broken—no amount of PPC optimization fixes that [2].
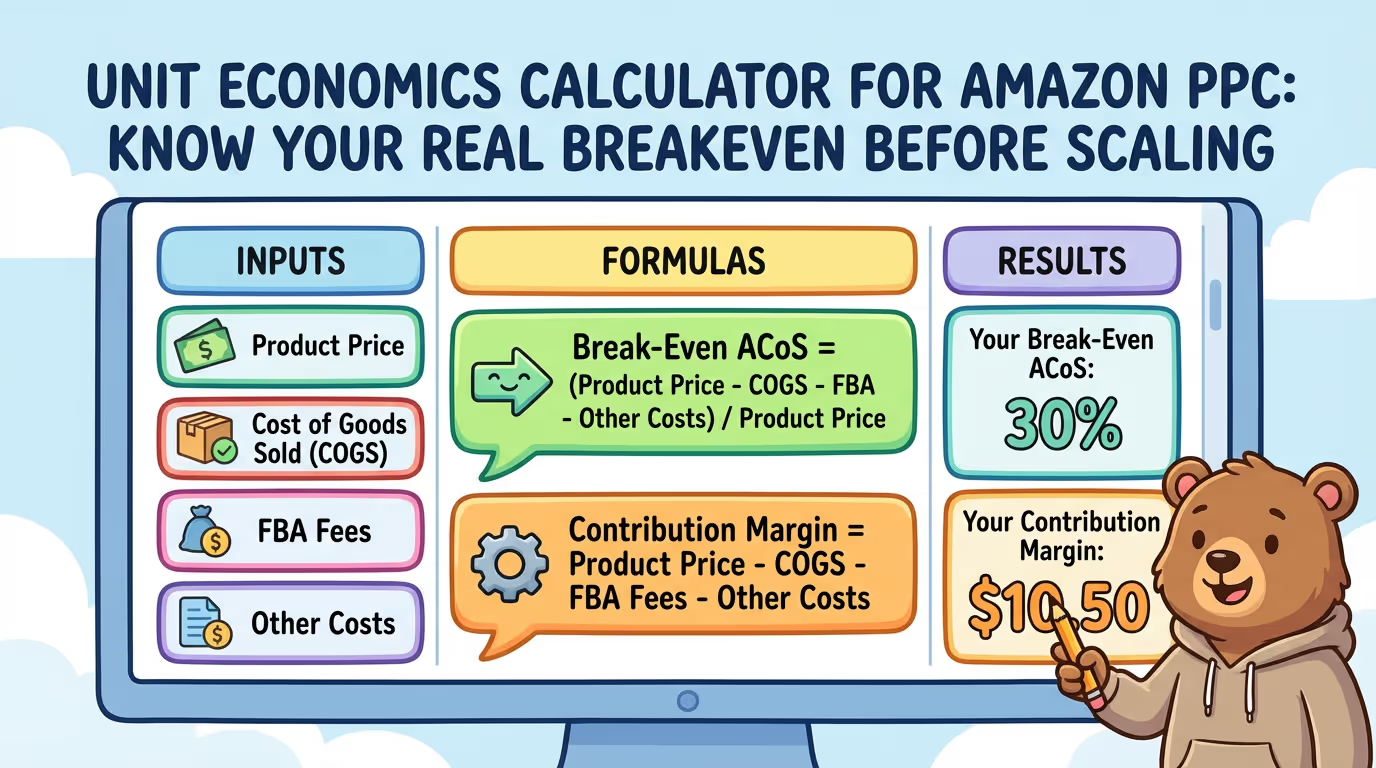
The Three Formulas You Actually Need
Forget the complicated spreadsheets with 47 columns. You need three numbers per SKU.
Formula 1: Break-Even ACoS
This tells you the maximum ACoS where you're not losing money.
Break-Even ACoS = (Net Profit Before PPC ÷ Selling Price) × 100
If your break-even ACoS is 25%, every dollar of ad spend above that threshold is eating your margin. Simple.
Formula 2: Contribution Margin
This is your profit per unit after all variable costs—including PPC.
Contribution Margin = Selling Price − (Landed COGS + Referral Fee + FBA Fulfillment + Storage + PPC Cost Per Unit)
This number tells you if the SKU is worth running ads on at all.
Formula 3: Target ACoS
This is your break-even ACoS minus your desired profit margin.
Target ACoS = Break-Even ACoS − Desired Profit Margin
If break-even is 30% and you want 10% profit margin, your target ACoS is 20%. Not 25%. Not "whatever the campaign is doing." Twenty percent.

A Real Example: The $35 Product
Let me walk through this with actual numbers.
The product:
Selling price: $35.00
Landed COGS: $9.00
Referral fee (15%): $5.25
FBA fulfillment: $5.20
Storage (allocated): $0.55
PPC cost per unit (current): $3.00
The math:
Total costs before PPC: $20.00Net profit before PPC: $15.00Break-even ACoS: ($15 ÷ $35) × 100 = 42.8%
Contribution margin after PPC: $35 − $20 − $3 = $12.00 (34.3%)
That's a healthy SKU. You have room to push ACoS up to 42% during ranking campaigns and still break even. Your 34% contribution margin gives you scaling headroom.
Now compare that to this SKU in the same account:
The problem child:
Selling price: $24.00
Landed COGS: $8.50
Referral fee: $3.60
FBA fulfillment: $5.20
Storage: $0.55
PPC cost per unit (current): $4.80
Total costs before PPC: $17.85Net profit before PPC: $6.15Break-even ACoS: ($6.15 ÷ $24) × 100 = 25.6%
Contribution margin after PPC: $24 − $17.85 − $4.80 = $1.35 (5.6%)
This SKU is barely alive. A 5.6% contribution margin means one bad week of conversion rates wipes out a month of profit. And the seller was spending $8K/month on ads for it.
That's not a PPC problem. That's a unit economics problem.
How to Actually Use This Data
Running the numbers is step one. Here's what you do with them.
Tier Your SKUs by Contribution Margin
| Tier | Contribution Margin | PPC Strategy |
| A | 25%+ | Scale aggressively, test broad match, push ranking |
| B | 15-25% | Maintain, optimize for efficiency, exact match focus |
| C | 10-15% | Throttle spend, eliminate waste, defend only |
| D | Below 10% | Cut ads entirely or fix unit economics first |
Most sellers treat every SKU the same. Same ACoS targets. Same budget allocation logic. Same optimization cadence.
That's how you end up funding losers with winners.
Set SKU-Specific ACoS Targets
Stop using account-level ACoS targets. They're meaningless.
Your $35 product with 42% break-even ACoS can run at 35% all day and print profit. Your $24 product needs to stay under 20% or it's underwater.
One target for both? You're either leaving money on the table or losing money. Probably both.
I build target ACoS into campaign naming conventions: "SKU123_Target28_Exact." Every optimization decision references that number. No guessing.
Prioritize Spend on High-Margin SKUs
This sounds obvious. It isn't happening in most accounts I audit.
Here's what I typically find:
40% of PPC budget going to SKUs with the lowest contribution margins
Top-margin SKUs running out of budget by 2pm
"Best sellers" getting most spend regardless of profitability
Flip the script. Your high-margin SKUs should get first priority on budget, bid increases, and new keyword testing. Low-margin SKUs get maintenance spend—if they get anything.
The Profit Feedback Loop we use starts here: launch with intent based on unit economics, not just sales velocity.

The Exit Valuation Multiplier Effect
Here's where this gets really interesting for sellers planning an exit.
Private equity and aggregators value Amazon businesses on a multiple of profit—typically 3-5x trailing twelve months [3]. For sellers planning an exit, optimizing unit economics is crucial.
A 5-point improvement in contribution margin doesn't just mean more cash today. It means a higher valuation tomorrow.
Quick math:
Account doing $3M revenue at 15% contribution margin = $450K profitSame account at 20% contribution margin = $600K profit
At a 3x multiple:
Before: $1.35M valuation
After: $1.8M valuation
That's $450K in additional exit value from fixing unit economics. Not from more sales. Not from new products. From understanding the numbers you already have.

Building Your Unit Economics Calculator
You don't need fancy software. A spreadsheet works fine.
Required columns:
SKU/ASIN
Selling price
Landed COGS
Referral fee
FBA fulfillment fee
Storage cost (allocated monthly)
Current PPC cost per unit
Break-even ACoS (calculated)
Current ACoS
Contribution margin (calculated)
Margin tier (A/B/C/D)
Target ACoS
Where to get the data:
Selling price: Business Reports
COGS: Your records (if you don't track this per SKU, start now)
Referral fee: 15% for most categories, verify in Fee Preview
FBA fees: Fee Preview or Revenue Calculator [4]
Storage: Monthly inventory reports, allocated per unit
PPC cost per unit: Total ad spend ÷ units sold (by SKU)
Run this monthly at minimum. Weekly for your top 20 SKUs by spend.
The sellers who do this consistently? They're the ones cutting wasted ad spend before it becomes a five-figure problem.

When Unit Economics Are Broken: Your Options
Sometimes the math just doesn't work. Here's what to do.
Option 1: Raise pricesTest it. Many sellers are underpriced because they set prices based on competition, not margin. A $2 price increase might lose 10% of sales but add 15% to contribution margin. That's a win.
Option 2: Reduce COGSRenegotiate with suppliers. Optimize packaging. Consolidate shipments. Every dollar off COGS drops straight to contribution margin.
Option 3: Cut PPC entirely on that SKUIf the product can sustain organic sales, let it. Not every SKU needs advertising. Some just need to exist and contribute to brand presence.
Option 4: Discontinue the SKUControversial but necessary. If unit economics don't work and can't be fixed, you're subsidizing a loss leader that isn't leading anywhere.
I've helped sellers cut bleeders that were consuming 30% of their ad budget while contributing nothing to profit. The relief on their faces when we reallocated that spend to winners? That's why I do this work.
The Profit-First PPC Approach
Here's what separates 7-figure sellers stuck at a plateau from those scaling to 8 figures.
The stuck ones optimize for ACoS.The scaling ones optimize for profit per click.
When you know your unit economics cold—SKU by SKU—you can make decisions that compound. You stop asking "is this ACoS good?" and start asking "is this profit per click acceptable for this margin tier?"
That shift changes everything.
Your campaigns become profit centers, not cost centers. Your scaling decisions become math problems with clear answers. Your exit valuation becomes a number you can actually engineer.
Want to see what this looks like in a real account? Check out the results we've driven using this exact approach.
Ready to know your real numbers?
Book a call and we'll audit your unit economics together—SKU by SKU. Most sellers find at least 20% of their ad spend is going to products that can't turn a profit at current margins.
Frequently Asked Questions
What's a good contribution margin for Amazon FBA products?
Target 20-30% contribution margin for SKUs you want to scale aggressively with PPC. Below 15%, you're running on thin ice—one conversion rate dip and you're underwater. Below 10%, your unit economics are fundamentally broken and no amount of PPC optimization will fix that. Fix the product economics first.
How do I calculate PPC cost per unit for my unit economics?
Pull your SKU-level advertising report and divide total ad spend by total units sold for each ASIN. Do this monthly to account for seasonality and campaign changes. If a SKU has $500 in ad spend and sold 100 units, your PPC cost per unit is $5. Use this actual number—not an estimate—in your contribution margin calculation.
Should I use break-even ACoS or target ACoS for bid optimization?
Use target ACoS for ongoing optimization—that's break-even minus your desired profit margin. Break-even ACoS is your ceiling, not your target. Running at break-even means you're working for free. Set target ACoS 5-10 points below break-even to build in profit margin and buffer for fluctuations.
How often should I recalculate unit economics?
Monthly at minimum for all SKUs. Weekly for your top 20 products by ad spend. FBA fees change, storage costs fluctuate seasonally, and COGS shifts with supplier negotiations or shipping costs. Sellers who treat this as a one-time exercise end up making decisions on outdated numbers.
Can unit economics tell me which SKUs to advertise?
Absolutely—this is one of the most valuable applications. SKUs with contribution margins above 25% after PPC deserve aggressive ad spend. SKUs below 15% should be throttled or cut entirely. Most accounts I audit have significant spend allocated to low-margin SKUs that will never turn profitable no matter how optimized the campaigns become.
About PPC Maestro
PPC Maestro is led by Bernard Nader, a profit-first Amazon PPC specialist who has managed millions in ad spend for 7- and 8-figure private label sellers. Bernard's approach—documented in the Profit Feedback Loop framework and operational SOPs—focuses on contribution margin and profit per click rather than vanity ACoS metrics. His strategies have been featured at Amazon seller summits and through his educational content on YouTube, where he breaks down real audit examples and system-driven optimization techniques.
Cited Works
[1] Jungle Scout — "The State of the Amazon Seller Report." https://www.junglescout.com/amazon-seller-report/
[2] Titan Network — "Amazon FBA Profitability Benchmarks." https://titannetwork.com/
[3] Empire Flippers — "How to Value an Amazon FBA Business." https://empireflippers.com/
[4] Amazon Seller Central — "Revenue Calculator." https://sellercentral.amazon.com/hz/fba/profitabilitycalculator/index